Agricultural Production Statistics in New Zealand
This week’s dataset is on New Zealand agriculture, complete with this quote from a May 2025 article:
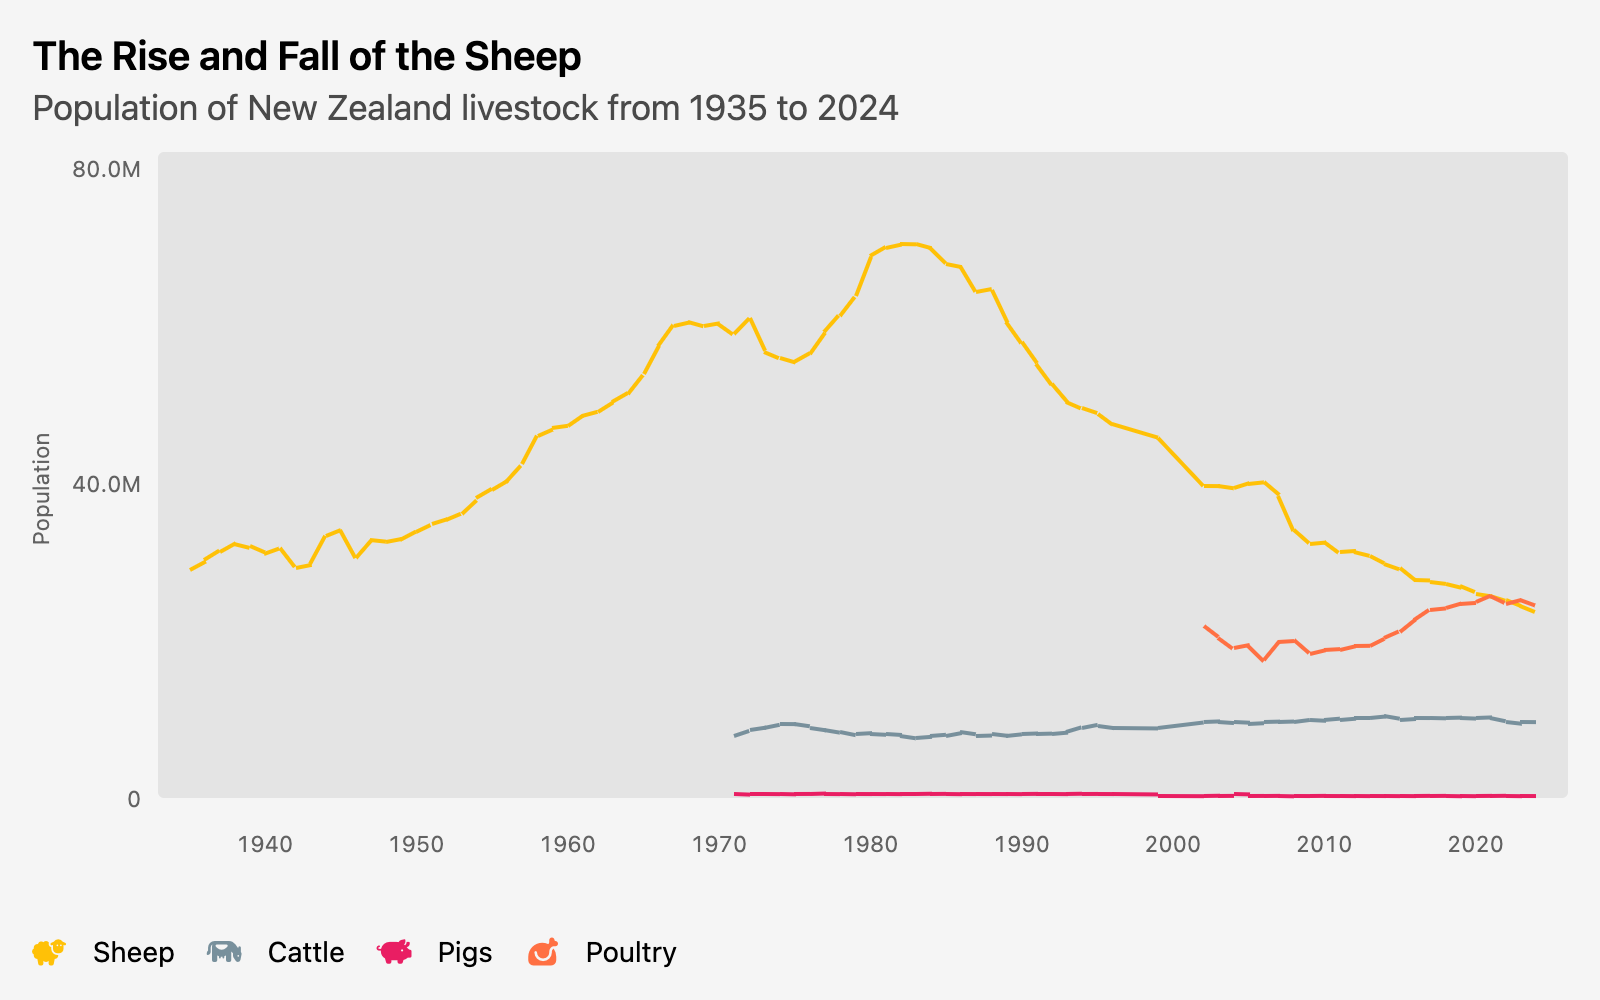
The gap between people and sheep in New Zealand is rapidly closing. There’s now about 4.5 sheep to every person in New Zealand compared to a peak of 22 sheep per person in the 1980s, that’s according to figures released by Stats NZ this week.
I went with the obvious one and put the total population of sheep, cattle, pigs, and poultry on a chart. (Most of my investment this week was developing this time-series line chart for Uncharted—plus integrating Font Awesome for the icons.)
The thing that almost got me was that they had “Total Cattle” up through 1999, and then I was only seeing “Total Beef Cattle” and “Total Dairy Cattle (including Bobby Calves)” broken out. I initially assumed this was when they’d introduced this breakdown, but eventually I realized they’d had those categories all along; they just also had the total for the first few decades of cattle data. So I was doubling the count until I caught that.
The Query
Most of the convoluted transformation here was doing some replacements to turn the records I wanted into simple sheep/cattle/pigs/poultry. I also had to specifically get the beef and dairy cattle and sum them, to exclude the “Total Cattle” records that were throwing off my data at first.
with

animal_types as (
     select year_ended_june as year,
            lower(trim(regexp_replace(measure, '^Total|\(including Bobby Calves\)$', '', 'g'))) as animal,
            value

       from "https://raw.githubusercontent.com/rfordatascience/tidytuesday/main/data/2026/2026-02-17/dataset.csv"
      where animal in ('sheep', 'beef cattle', 'dairy cattle', 'pigs', 'poultry')
),

pivot_animals as (
      pivot animal_types on animal
      using sum(value)
   order by year
)

   select * exclude ("beef cattle", "dairy cattle"),
          "beef cattle" + "dairy cattle" as cattle
     from pivot_animals