Edible Plants Database
This week is exploring the Edible Plants Database. This is the first one this year with a decent amount of quantitative data, so I immediately went to scatter plots, trying different things on each axis. The inspiration hit when I started thinking about the relationship between energy going into a plant versus the energy coming out of it. In the end I landed on the time for a plant to grow, the minimum temperature it needs, and water requirements as proxies for energy being invested in a plant—with bubble size representing the return.
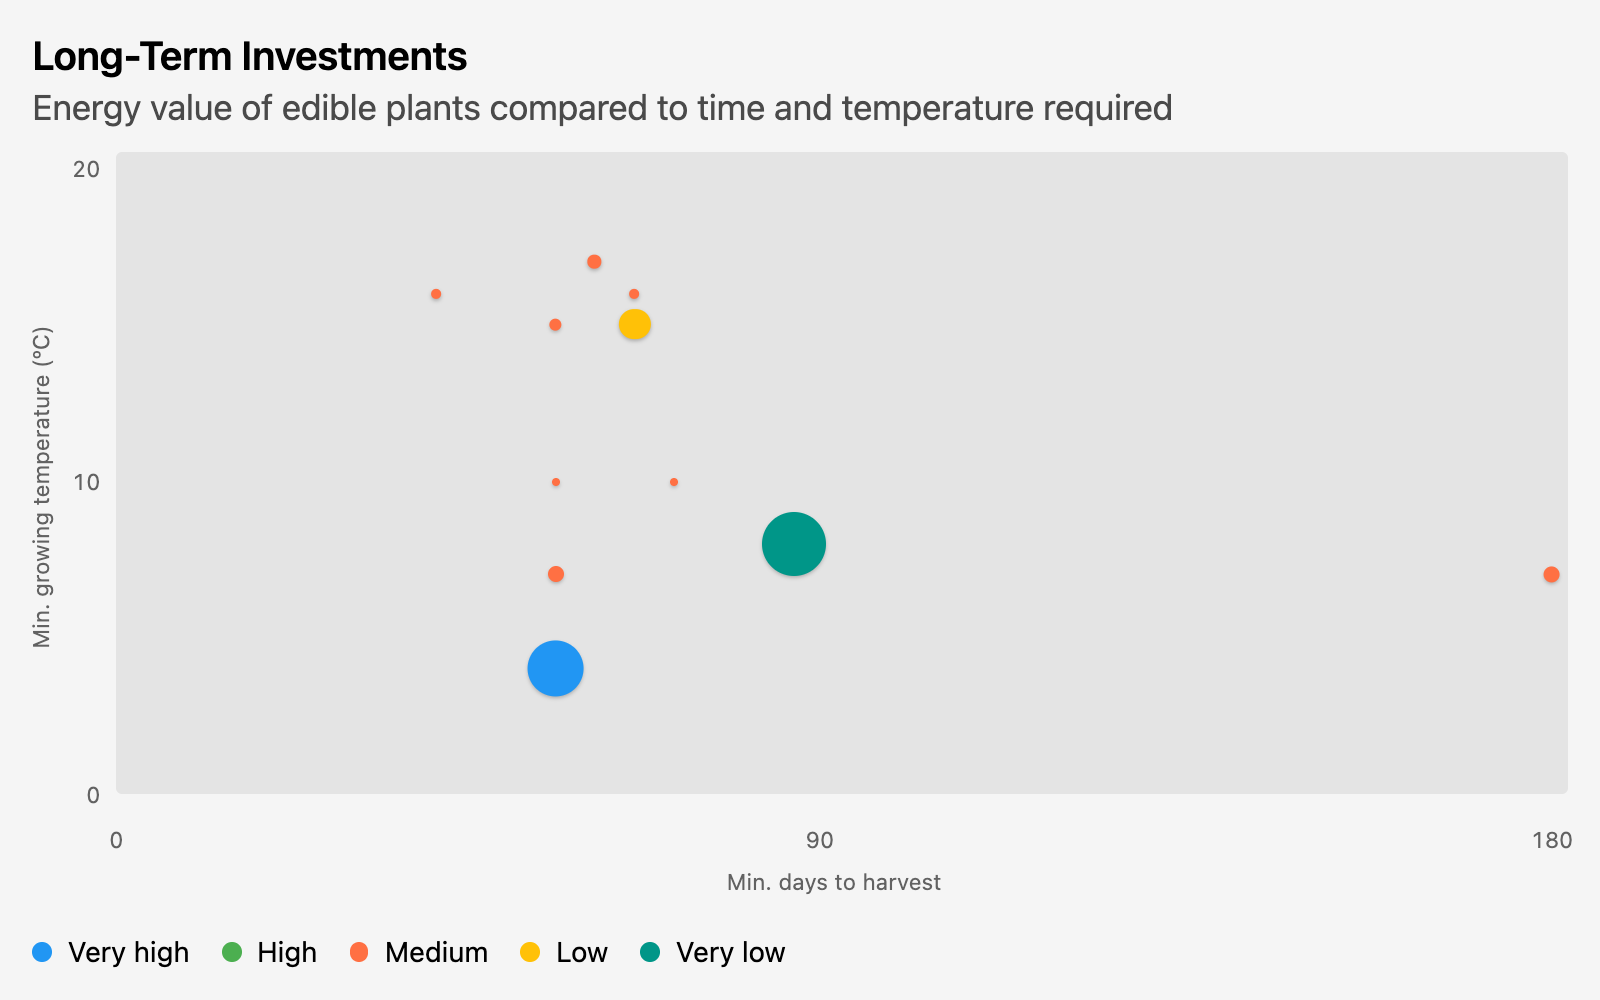
Only 12 of the plants in this dataset actually had energy values listed, so I also wanted to see all the plants on here, ignoring energy:
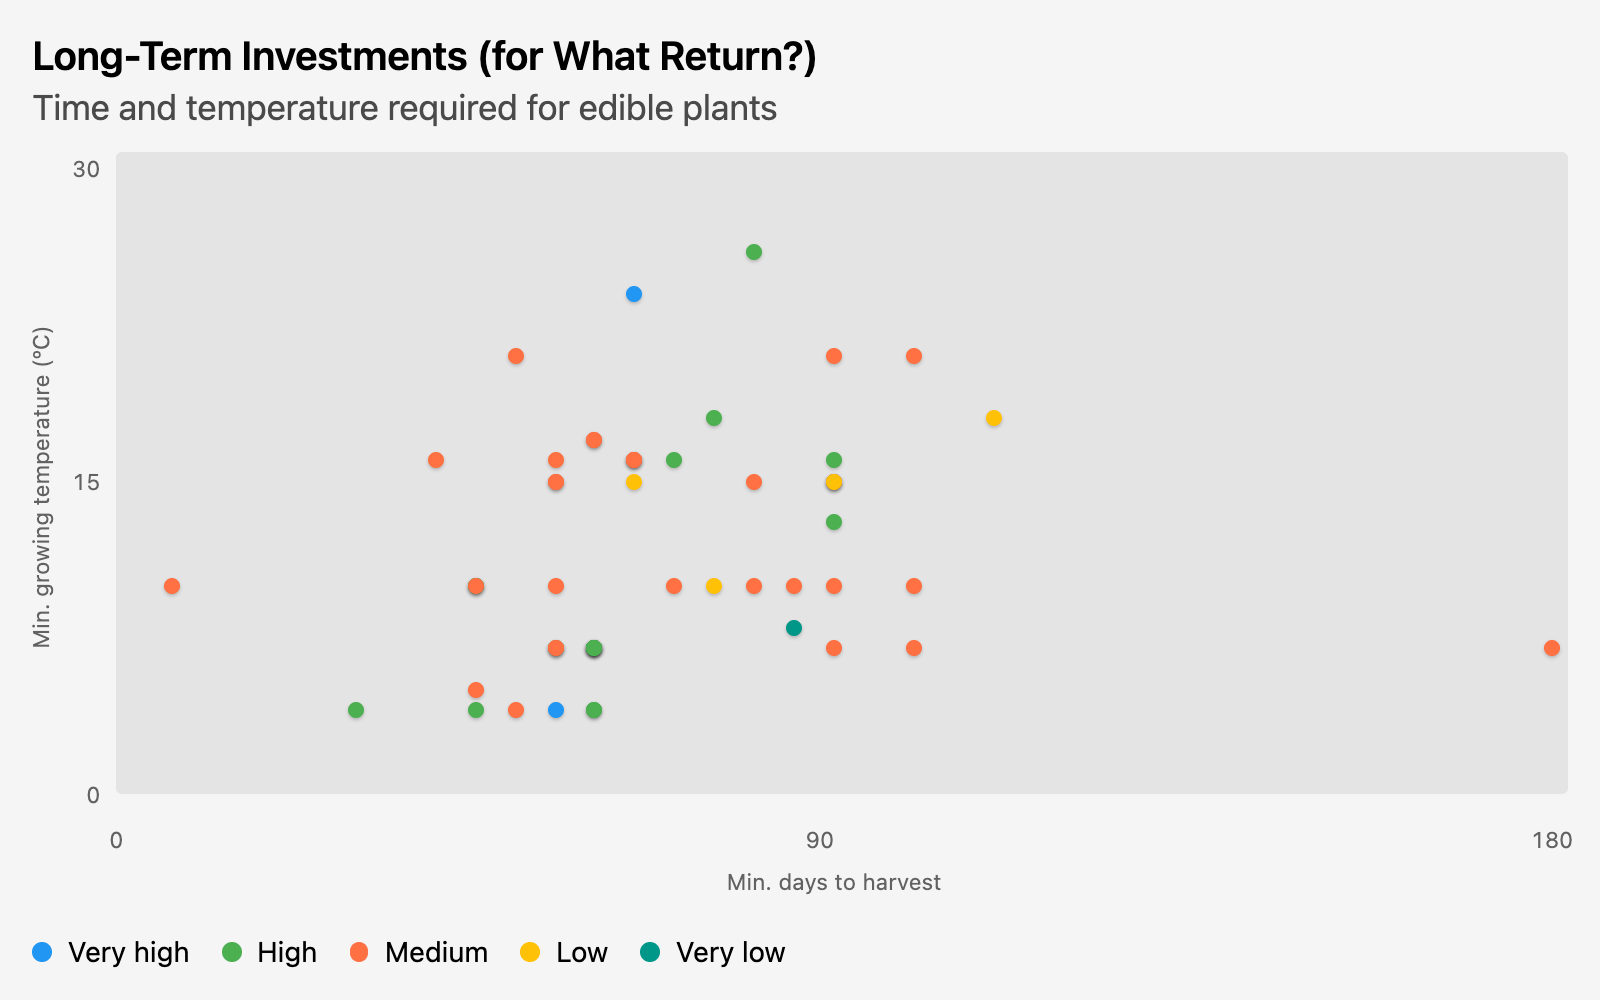
I hope those Brussels sprouts are worth it.
Queries
My staging table involved a lot of turning non-numeric columns into numbers. And fixing the wildly inconsistent capitalization in the water column. There were several ranges I split up for exploration, but I only ended up using a couple of those columns in the final analysis.
 select * exclude(temperature_germination, temperature_growing, days_germination, days_harvest)  -- exclude the columns being split
        replace(
          try_cast(energy as numeric) as energy,  -- try_cast as numeric to get rid of junk like 'NA'
          upper(water[1])||lower(water[2:]) as water  -- I really wish DuckDB had initcap
        ),
        -- Get the first part of ranges for min
        -- Get the second part for max, or fall back to min
        -- try_cast all as numeric for the same reason as above
        try_cast(split_part(temperature_germination, '-', 1) as numeric) as temp_germ_min,
        try_cast(coalesce(nullif(split_part(temperature_germination, '-', 2), ''), temp_germ_min) as numeric) as temp_germ_max,
        try_cast(split_part(temperature_growing, '-', 1) as numeric) as temp_grow_min,
        try_cast(coalesce(nullif(split_part(temperature_growing, '-', 2), ''), temp_grow_min) as numeric) as temp_grow_max,
        try_cast(split_part(days_germination, '-', 1) as numeric) as days_germ_min,
        try_cast(coalesce(nullif(split_part(days_germination, '-', 2), ''), days_germ_min) as numeric) as days_germ_max,
        try_cast(split_part(days_harvest, '-', 1) as numeric) as days_harvest_min,
        try_cast(coalesce(nullif(split_part(days_harvest, '-', 2), ''), days_harvest_min) as numeric) as days_harvest_max,

  from "https://raw.githubusercontent.com/rfordatascience/tidytuesday/main/data/2026/2026-02-03/edible_plants.csv"
From there, the query to set up my chart was a pretty straightforward select, with a conditional in order by to sort the water series column the way I wanted.
   select common_name,
          days_harvest_min as x,
          temp_grow_min as y,
          energy as size,
          water as series

     from edible_plants
    where days_harvest_min is not null
      and energy is not null

 order by case water
               when 'Very high' then 1
               when 'High' then 2
               when 'Medium' then 3
               when 'Low' then 4
               when 'Very low' then 5
               end,
          x, y
The query for the second chart was just duplicated and tweaked, removing energy as size and filtering on temp_grow_min instead:
   select common_name,
          days_harvest_min as x,
          temp_grow_min as y,
          water as series

     from edible_plants
    where days_harvest_min is not null
      and temp_grow_min is not null

 order by case water
               when 'Very high' then 1
               when 'High' then 2
               when 'Medium' then 3
               when 'Low' then 4
               when 'Very low' then 5
               end,
          x, y