Astronomy Picture of the Day (APOD) Archive
Another one that stumped me for a bit. I could break down the data by media type (image, video, or other) or copyright holder, but neither of those were very interesting. The most interesting data was in the copy—the titles and explanations, but short of running AI analysis or feeding them into a word cloud I wasn’t sure what to actually do with all the text.
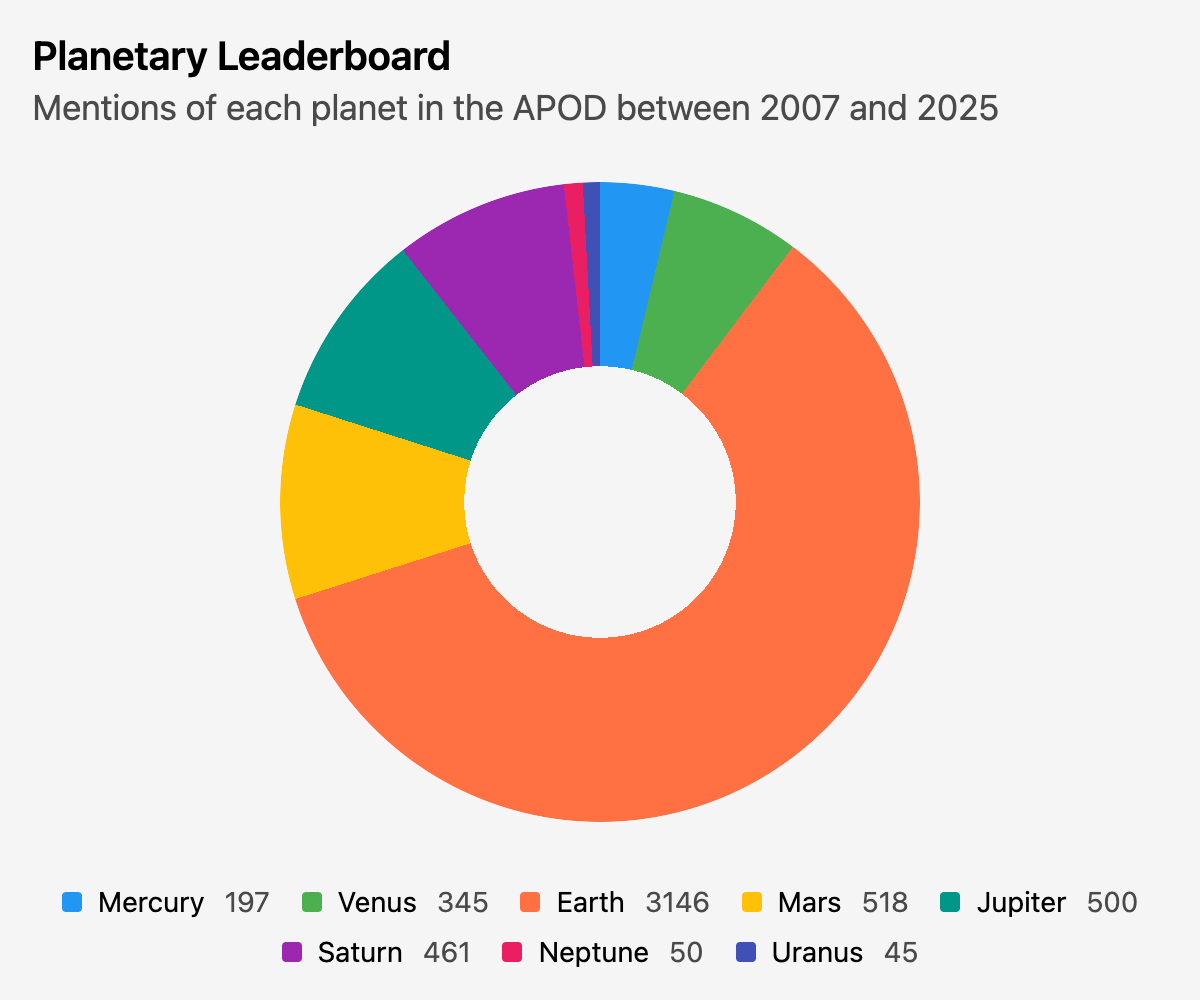
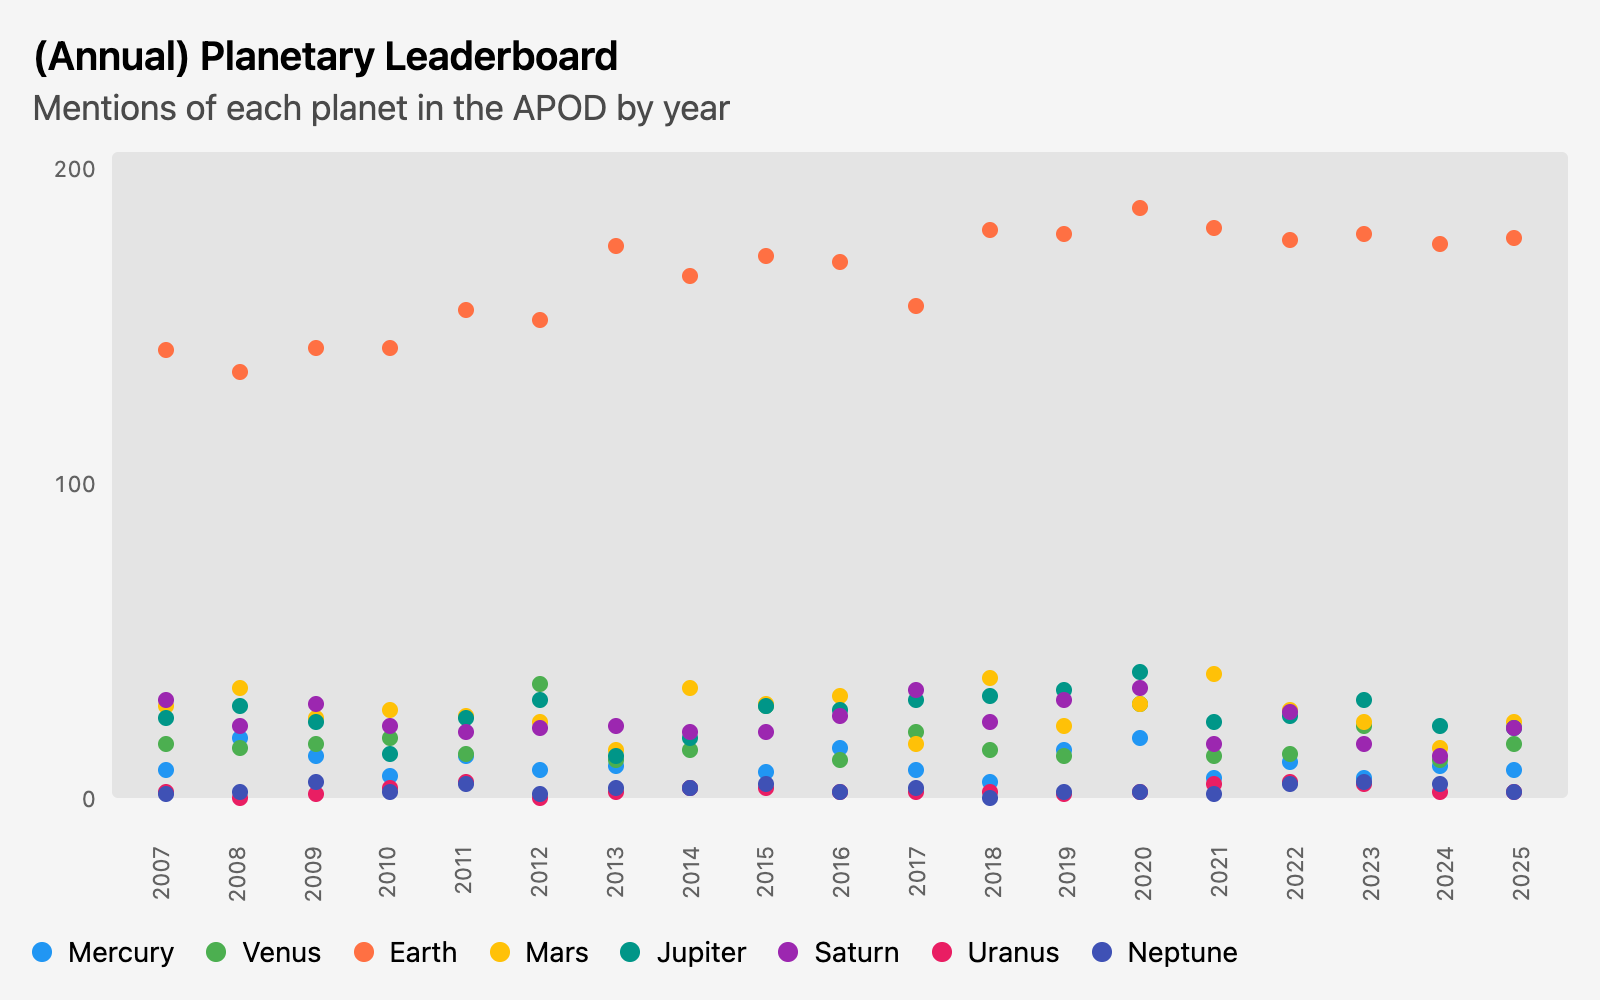
In the end the idea was to limit the scope—pull out just mentions of any of the eight planet names in concatenated titles/explanations, dedupe them by entry and planet (so a single image doesn’t count for 5 Jupiters and 4 Saturns, just one of each), and then count them up. I did overall counts and by year just to get a couple different visuals in here.
I know pie/donut charts are anathema among us data professionals and I generally avoid them—but it kind of works for a chart about planets, right?
I’m not sure what one would use this data for, but it made for an interesting visual.
Queries
Since I ended up doing two charts, I have a view for the shared query that extracts mentions for each planet, keeping the year as well.
create or replace view planet_mentions as

 select year(date) as year,
        unnest(  -- Unnest each list of mentions into a row for each planet
          list_distinct(  -- Remove duplicates from individual entries
            -- Extract all mentions of any planet name in the title or explanation
            regexp_extract_all(title || ' ' || explanation,'Mercury|Venus|Earth|Mars|Jupiter|Saturn|Uranus|Neptune')
          )
        ) as planet
   from "https://raw.githubusercontent.com/rfordatascience/tidytuesday/main/data/2026/2026-01-20/apod.csv"
I query that view, just counting each planet and ignoring the year:
create or replace view planets as

   select planet,
          count(*) as images
     from planet_mentions
 group by all
And another query pivots the data for the dot chart by year, with a series for each planet:
create or replace table planets_by_year as

-- Pivot and count them
with pivot_planets as (
     pivot planet_mentions on planet using count(*)
)

-- Reorder the columns
select year, Mercury, Venus, Earth, Mars, Jupiter, Saturn, Uranus, Neptune from pivot_planets
Finally, I copy planets and planets_by_year to CSV files in this project.
copy planets to 'planets.csv';
copy planets_by_year to 'planets_by_year.csv';
The planets query didn’t order the planets in any particular way. I could’ve added a CTE with a conditional to create a sort column, and then removed the sort column in a final select statement. Instead, I just reordered the CSV by hand.