The Languages of Africa
The first curated dataset for 2026 is African languages, including country, language family, and speaker count.
I took a lot of different stabs at this one before landing on an approach. I tried a scatter plot looking at total number of speakers versus number of countries for each language, across all… *(checks notes)*
select count(distinct language) from "https://raw.githubusercontent.com/rfordatascience/tidytuesday/main/data/2026/2026-01-13/africa.csv"…502 languages. That looked like an unreadable cluster in the lower left with a handful of dots scattered around the rest of the chart area (most notably Arabic, spoken natively by 1.8 billion people across 12 countries).
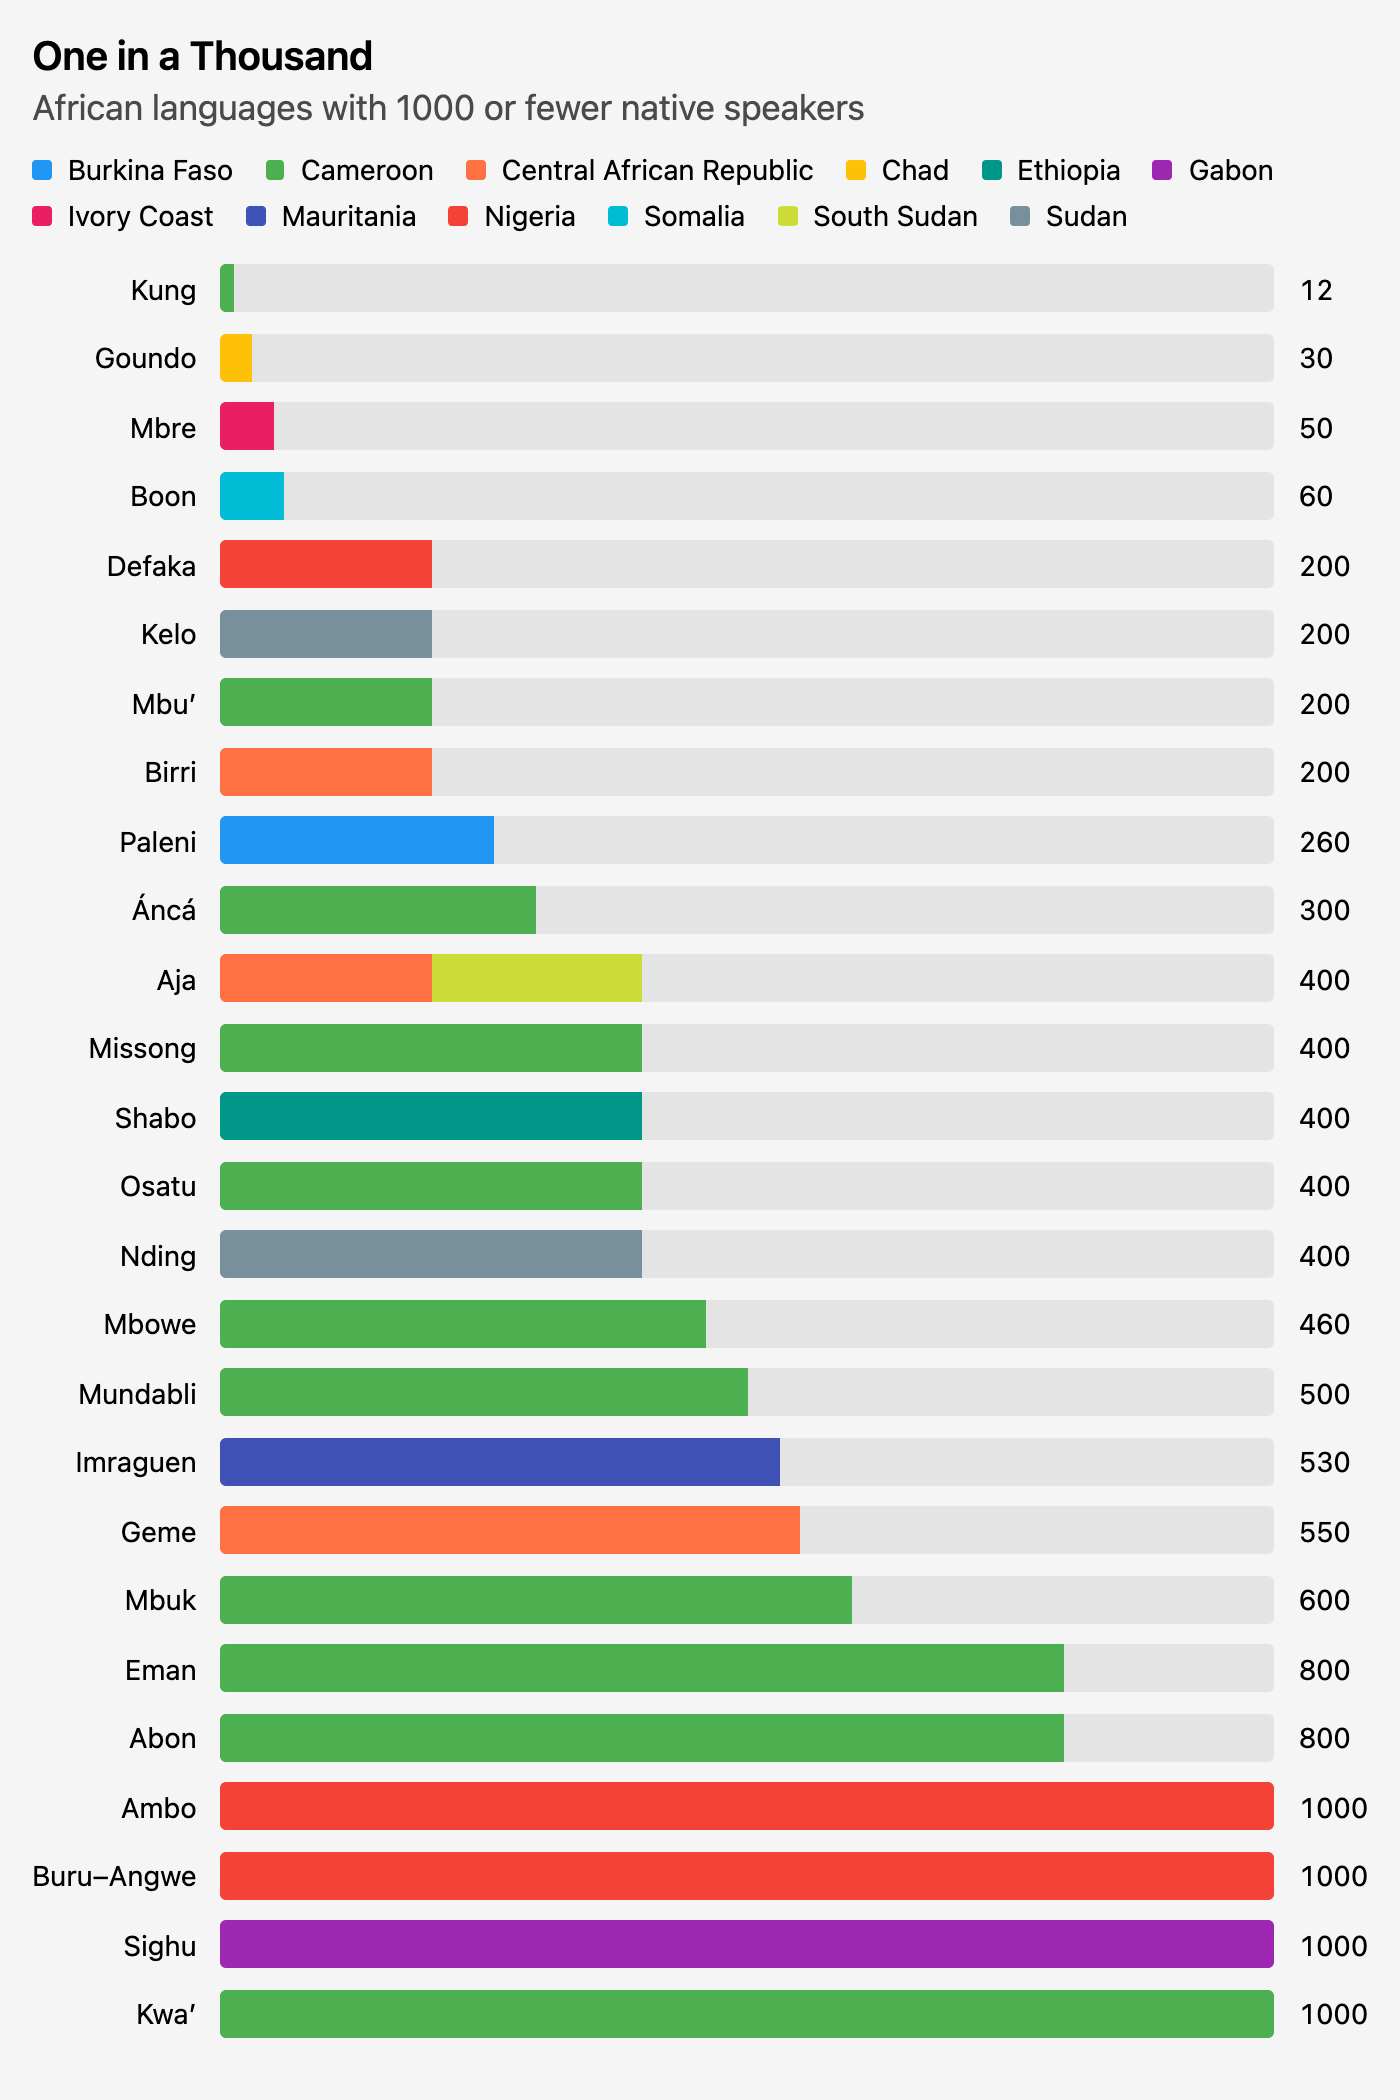
After thinking about it for a minute, I actually wanted to zoom in on the ones closest to (0, 0)—the ones spoken by the fewest people. There’s no defined threshold for an endangered language, but 1000 left me with a manageable 26 languages.
A few things I noticed:
- All of these are spoken within the borders of a single country, except Aja, split across the Central African Republic and South Sudan.
- A lot of these are in Cameroon.
- Twelve speakers?!
Queries
The final query I ended up using was:
create or replace table africa as

-- Get languages with up to 1000 speakers, totaled across countries
with languages as (
   select language,
          country,
          native_speakers,
          sum(native_speakers) over (partition by language) as total_speakers

     from "https://raw.githubusercontent.com/rfordatascience/tidytuesday/main/data/2026/2026-01-13/africa.csv"
  qualify total_speakers <= 1000
),

-- Pivot on countries to create an individual series for each
pivot_countries as (
    pivot languages on country
    using sum(native_speakers)
 order by total_speakers
)

-- Drop the total_speakers column from the final table
select * exclude total_speakers from pivot_countries
I copied the resulting africa table to CSV.