Claude Code Adoption
I’m back for TidyTuesday, catching up on the first couple weeks of 2026. Week 1 was a bring-your-own-dataset week. This is one of the pieces of data I was just crunching for a year-in-review dataviz project at work—the project that inspired me to start my Uncharted plugin, which then enabled this new site. So it seemed like a fitting place to start.
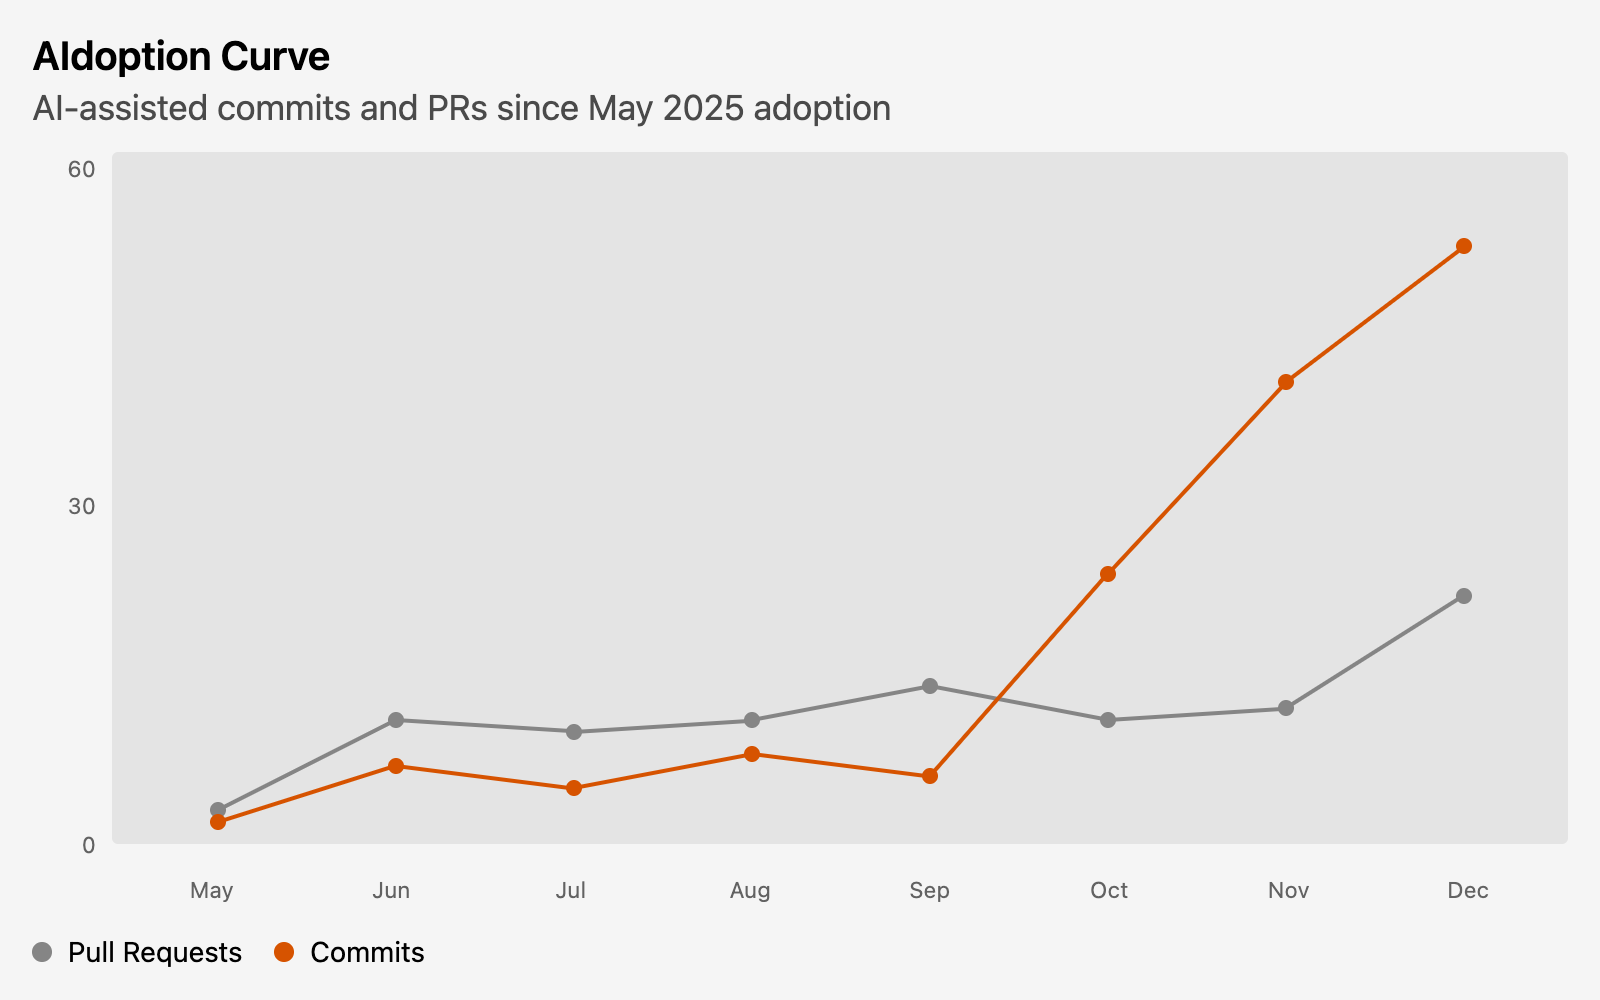
The project was called “Atlas Wrapped 2025”, Atlas being the name of our data platform, and it was presenting stats from our dbt project—counting commits and pull requests, types and priorities of issues opened and completed, new models by domain, and so on. I devoted a section to Claude Code adoption, since that became a significant piece of my development workflow last year. The focal point of that section was the chart below, showing the rise in pull request descriptions written by Claude and commits co-authored by Claude.
It was interesting to see the data bear out my memory of how adoption unfolded. Early on, I was mostly using Claude Code to analyze code and generate documentation and PR descriptions, starting to pair program a bit on the SQL code itself, but I was still doing most commits. Over time, as Claude models got smarter, the CLAUDE.md project memory that I built out became more comprehensive, and my trust grew in response, I began handing off larger and larger projects to Claude—doing a lot of back-and-forth in planning mode, but then letting Claude execute the plan and write most of the code with auto-accept edits on. You can see the spike really take off in October.
Queries
I won’t include the raw source data for this, but I had Claude Code generate two JSON files using git and the gh GitHub CLI. Here are the commands it ran:
For PRs:
gh pr list --state merged --limit 500 --json number,title,body,headRefName,mergedAt --jq '[.[] | select(.mergedAt | startswith("2025"))]' > ~/Desktop/prs_2025.jsonFor commits:
git log --since="2025-01-01" --until="2026-01-01" --format='%H%x00%an%x00%ai%x00%B%x00' | python3 -c '
import sys, json
commits = []
data = sys.stdin.read().split("\x00")
i = 0
while i + 3 < len(data):
    sha, author, date, body = data[i], data[i+1], data[i+2], data[i+3].strip()
    if sha:
        commits.append({"sha": sha, "author": author, "date": date, "message": body})
    i += 4
print(json.dumps(commits, indent=2))
' > ~/Desktop/commits_2025.json
I did some data exploration in chunks, but in the end I compiled one query to create the transformed data as a table (in-memory):
create or replace table claude_adoption as

-- Extract months and flag AI-generated PR descriptions
with prs as (
   select strftime(mergedAt, '%b') as month,
          month(mergedAt) as month_num,
          body like '%Generated with [Claude Code]%' as is_ai_assisted

    from prs_2025.json
),

-- Extract months and flag AI-authored commits,
-- including converting the date column to a timestamp
commits as (
   select strptime(date, '%c %z') as committed_at,
          strftime(committed_at, '%b') as month,
          month(committed_at) as month_num,
          message like '%Co-Authored-By: Claude%' or author = 'Claude' as is_ai_assisted

     from commits_2025.json
),

-- Summarize each data set by month
count_prs as (
   select month,
          month_num,
          count_if(is_ai_assisted) as prs

     from prs
 group by all
),

count_commits as (
   select month,
          month_num,
          count_if(is_ai_assisted) as commits

     from commits
 group by all
),

-- Join the two sets of monthly data
joined as (
     from count_prs
     join count_commits
    using (month, month_num)
 order by month_num
),

-- Select the columns for the final table
final as (
   select month,
          prs,
          commits

     from joined
    where month_num >= 5
)

from final
Once I had that table, I exported it to a CSV in my tidytuesday project:
copy claude_adoption to 'claude_adoption.csv'Uncharted reads that CSV from there and generates the chart above when the site is built.