Henley Passport Index
Note: This is the first post I’m porting from my old site, in February 2026. I don’t have interactive filters available on this new site (yet), so instead I manually ran this for a selection of countries that made for interesting comparisons.
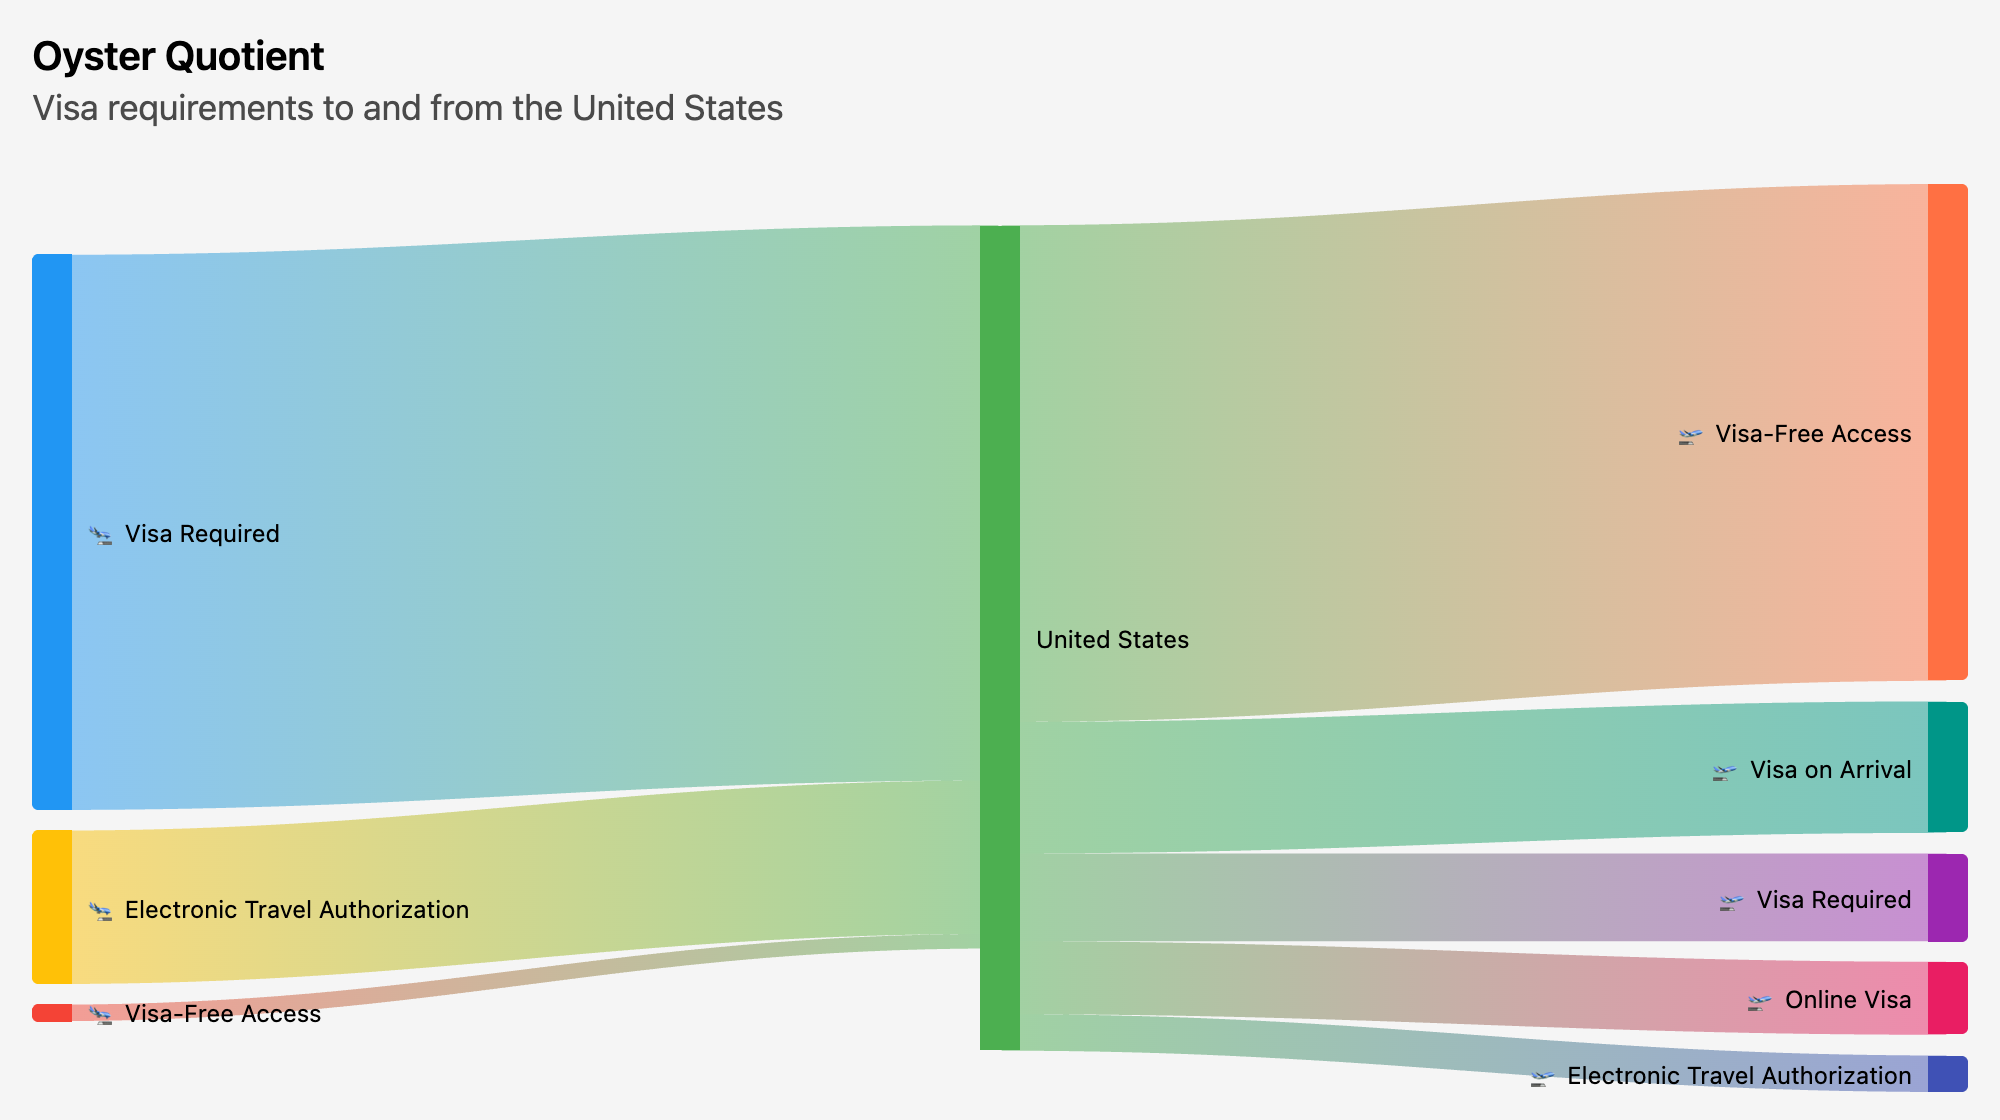
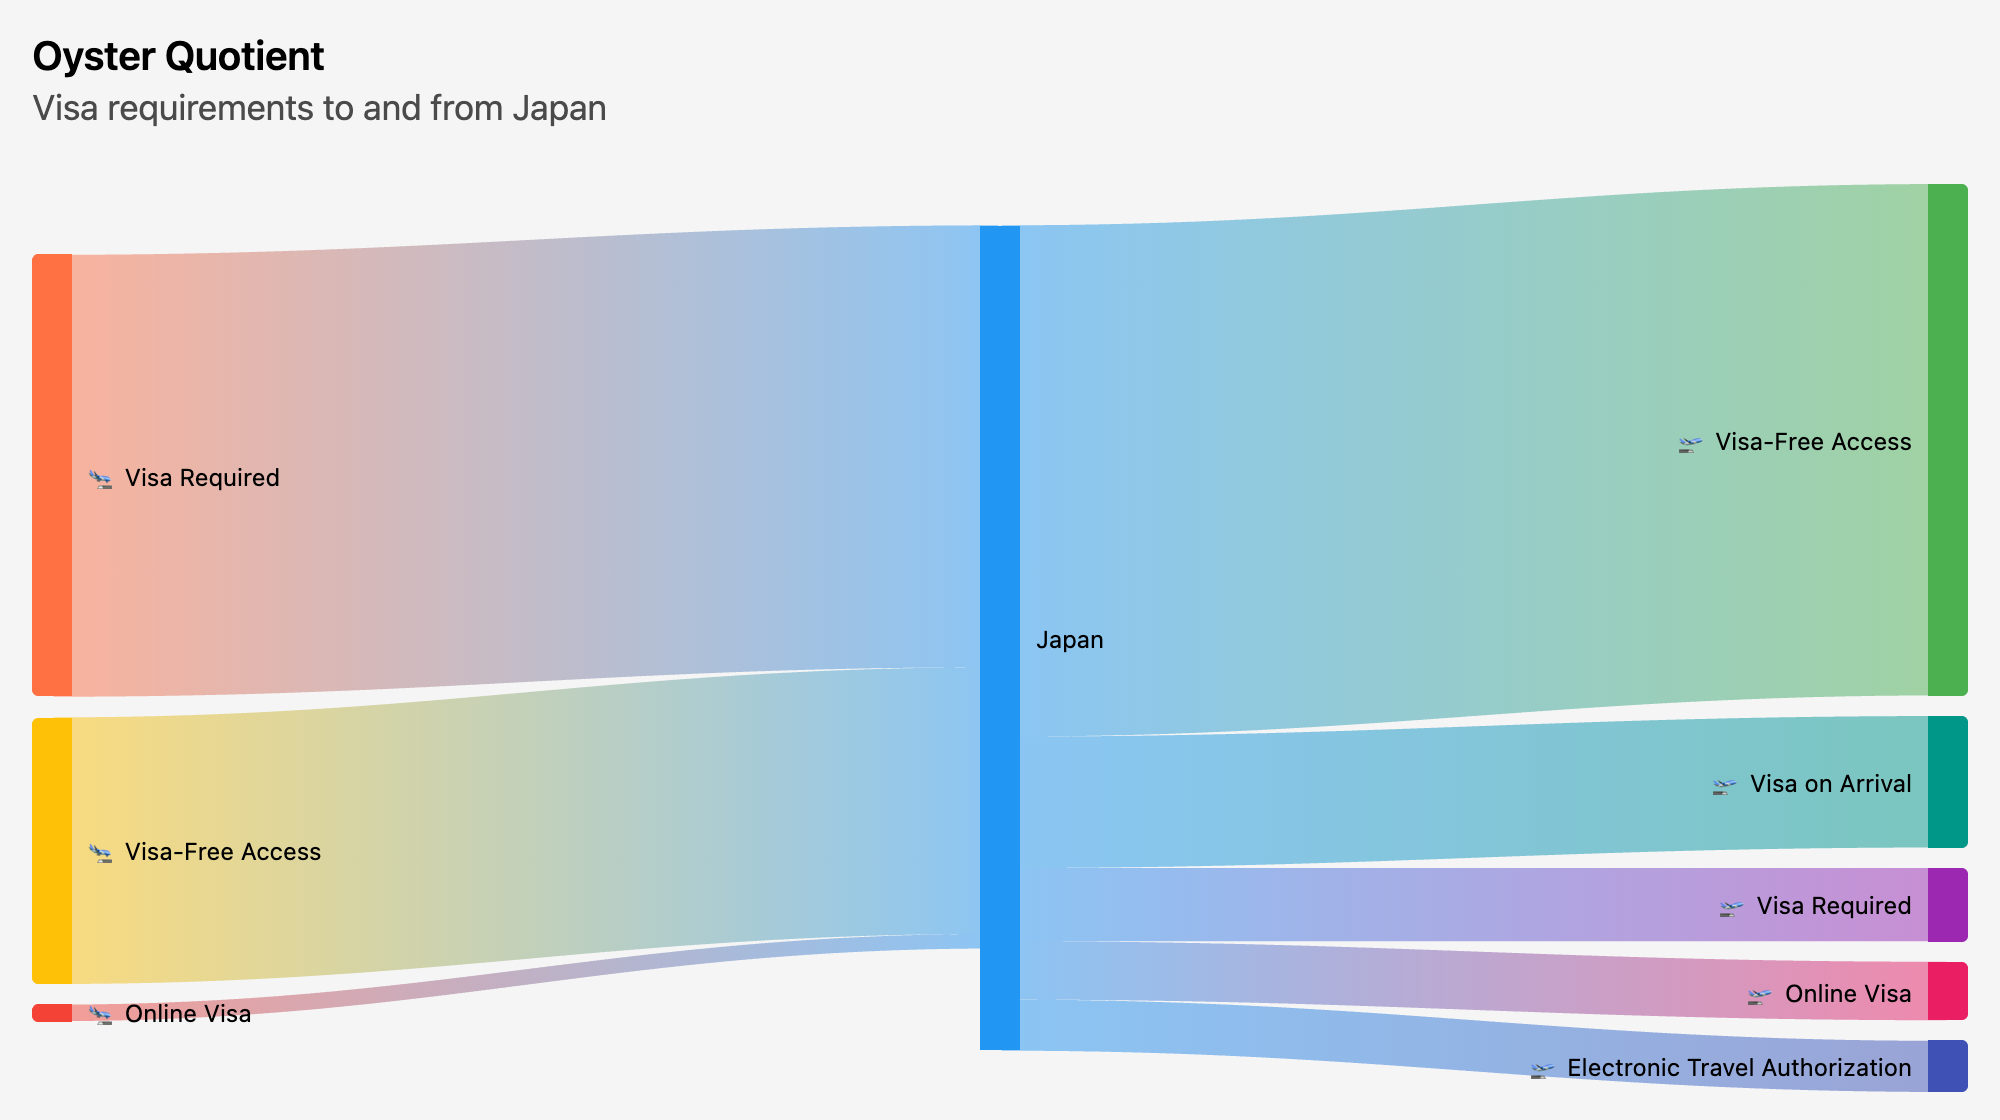
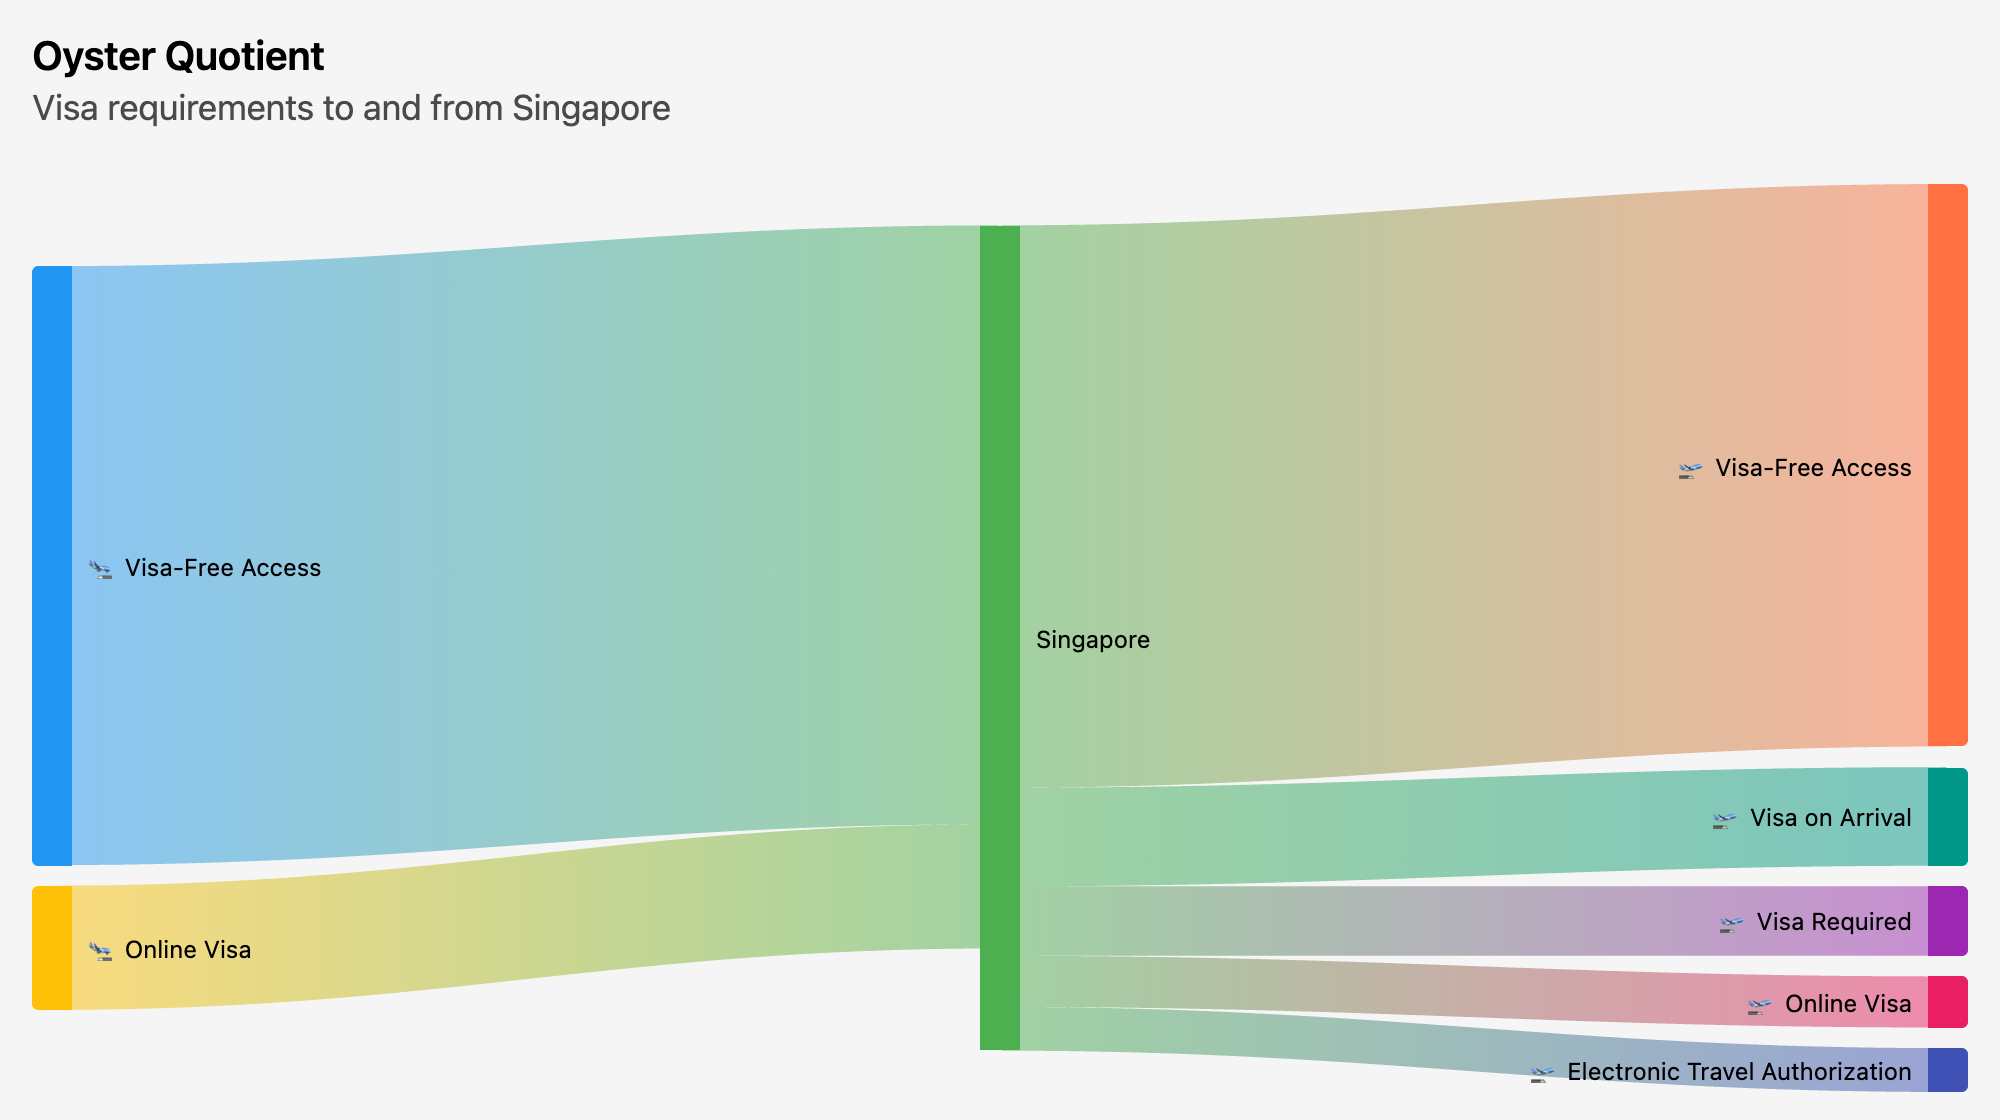
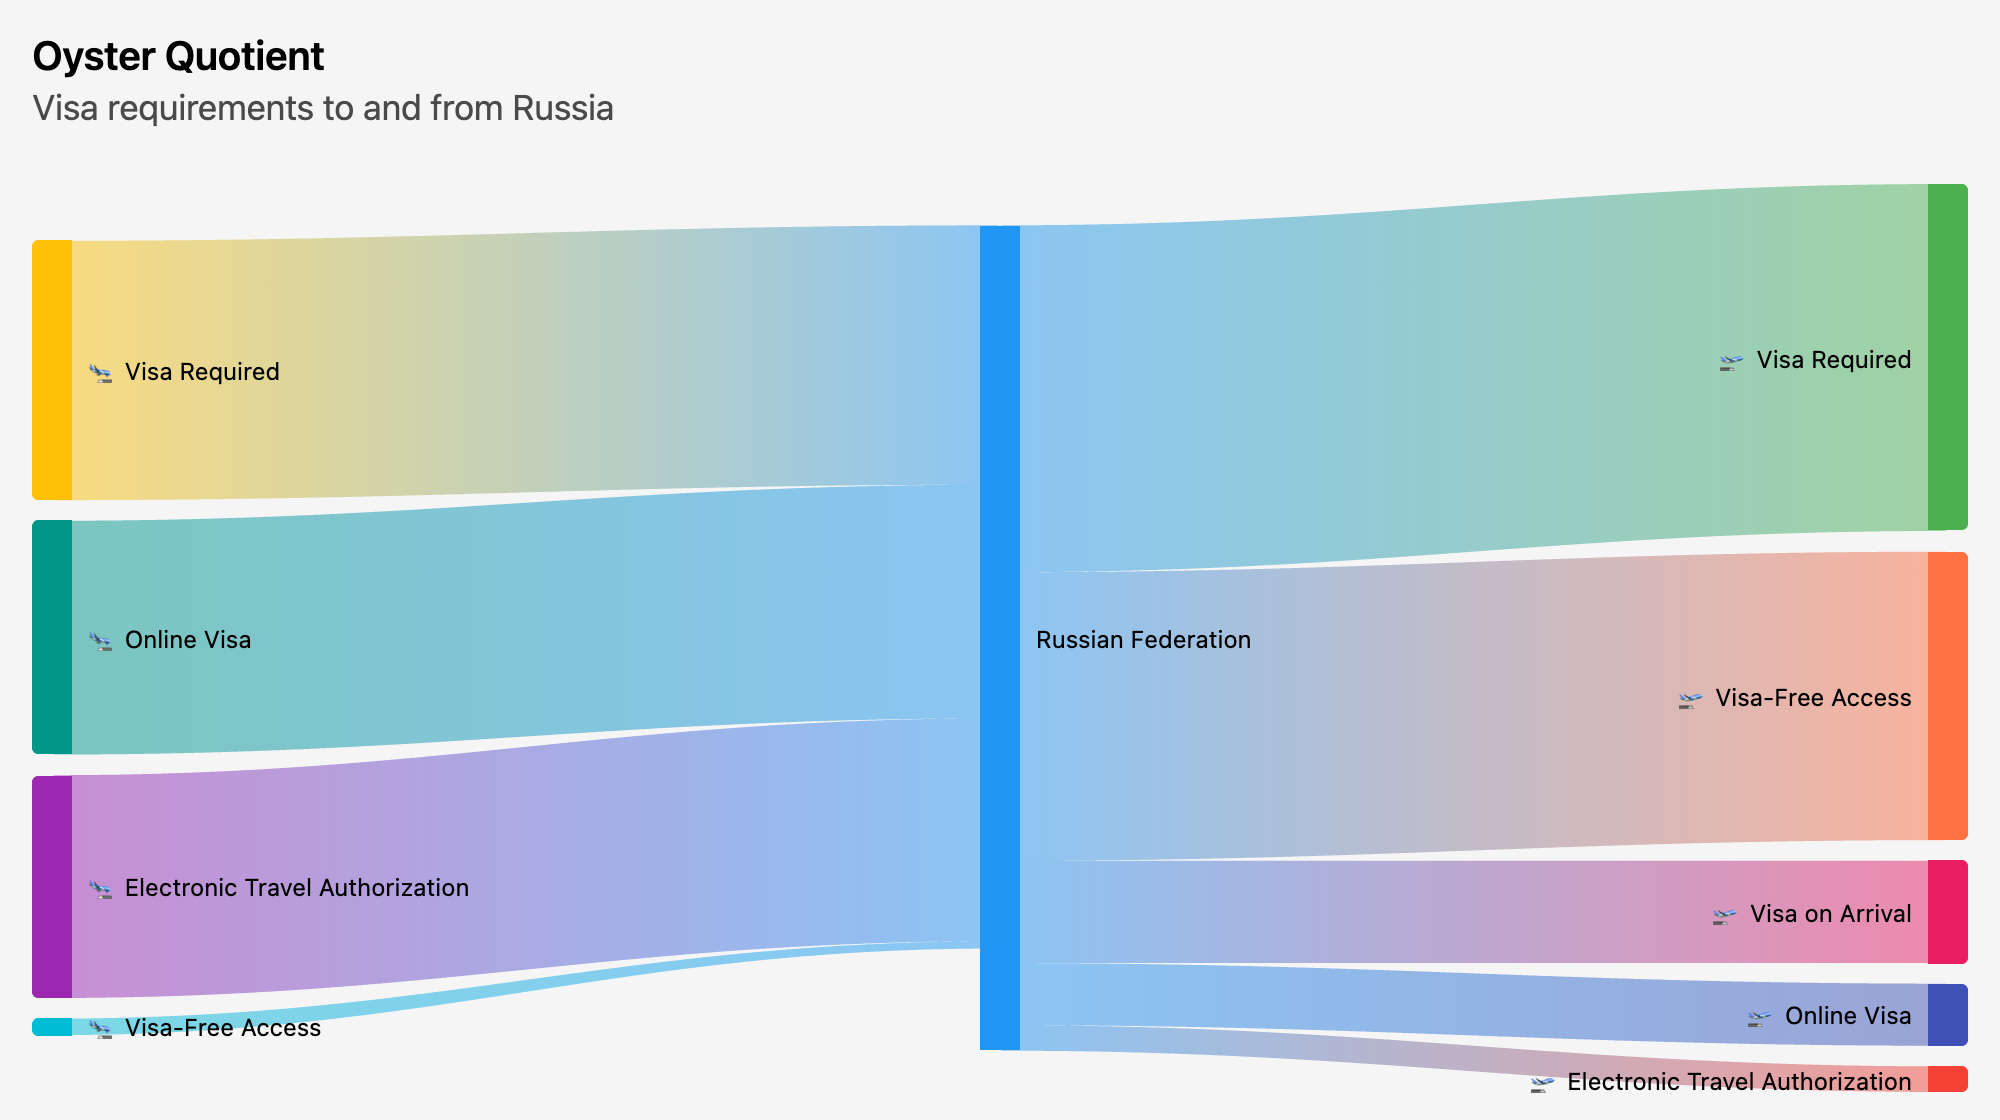
This week we’re looking at the Henley Passport Index, which scores passports based on their visa-free access to other countries. The provided datasets included both historical scores for each country, as well as visa requirements for each passport country to each destination. Of course, I’m personally really interested in this kind of data, and there were a lot of directions I would’ve liked to go with it.
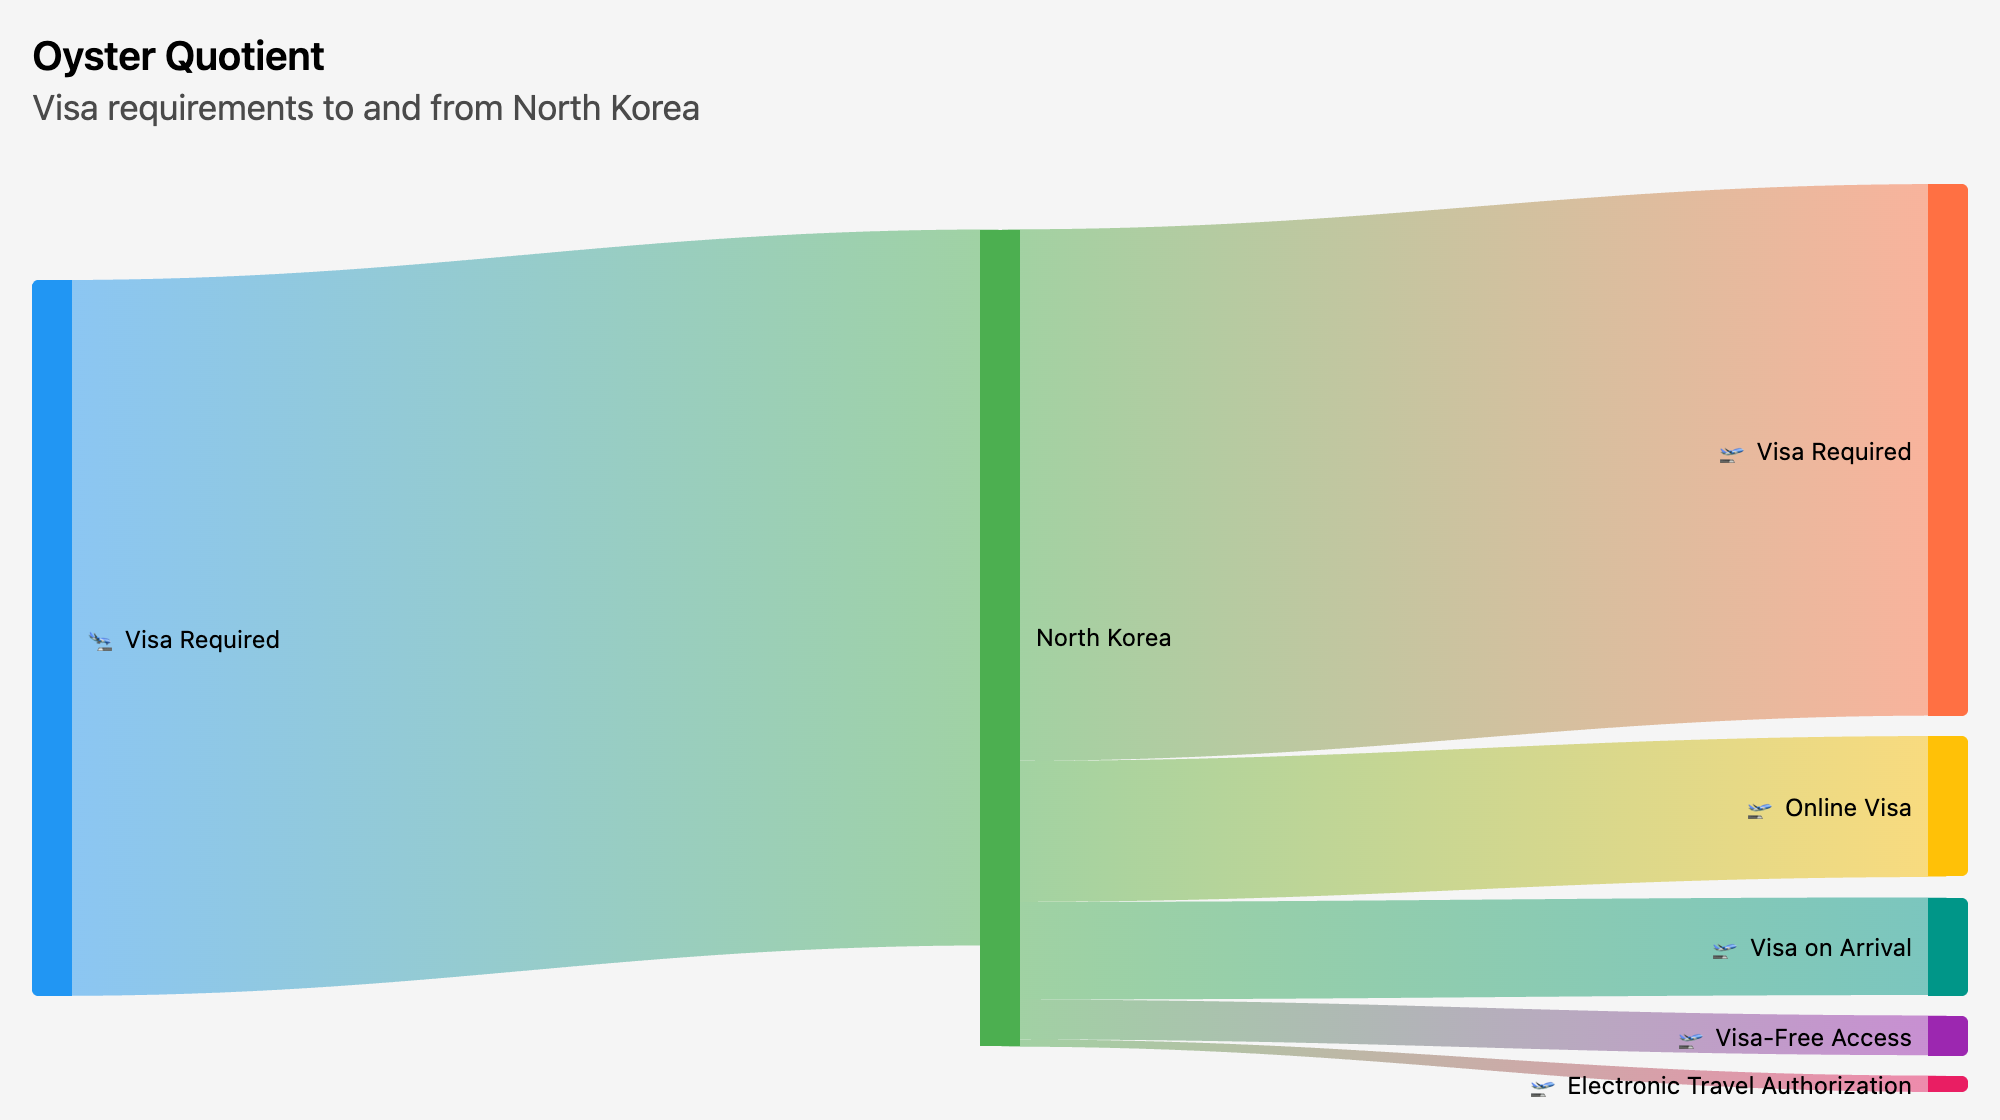
In the end, I thought it would be interesting to see the juxtaposition of what kind of access was granted to a given passport next to what that same country required of other passport holders. I also thought the Sankey flow diagram made for an interesting visual representation.
The world isn’t everyone’s oyster.
Queries
What I said on my old site about live queries no longer applies here. Now I am generating a CSV for each chart. That said, the actual queries I used didn’t change much. I started by unpivoting and unnesting the JSON:
with

unpivoted as (
  unpivot 'https://raw.githubusercontent.com/rfordatascience/tidytuesday/main/data/2025/2025-09-09/country_lists.csv'
       on columns(* exclude (code, country)) into
     name visa_requirement
    value countries
),

unnested as (
   select country,
          visa_requirement,
          unnest(from_json(countries, '[[{"code":"VARCHAR","name":"VARCHAR"}]]'), recursive := true)

     from unpivoted
),

renamed as (
   select country as passport,
          name as destination,
          case visa_requirement
               when 'visa_required' then 'Visa Required'
               when 'visa_online' then 'Online Visa'
               when 'visa_on_arrival' then 'Visa on Arrival'
               when 'visa_free_access' then 'Visa-Free Access'
               when 'electronic_travel_authorisation' then 'Electronic Travel Authorization'
                end as visa_requirement

     from unnested
)

from renamed
I used pretty much the same query for each country’s CSV as I had running live on the old site, minus the templating to use the dropdown value. (I think of all chart types, the format for the tabular data is actually most similar between Uncharted and Evidence for the Sankey diagram.)
 select '🛬 ' || visa_requirement as source,
        destination as target,
        count(*) as count
   from visa_requirements_unpivoted
  where destination = 'United States'
  group by all

  union all

 select passport as source,
        '🛫 ' || visa_requirement as target,
        count(*) as count
   from visa_requirements_unpivoted
  where passport = 'United States'
  group by all

  order by count desc